2. Overview
2.1. Tool Overview
CviPQ Tool is a professional image quality tuning tool.
After connecting the tool with a single board, it can provide users with online debugging of ISP module parameter adjustment, and at the same time, it can watch the effect of parameter setting in real time.
In addition, ISP calibration function is also provided to generate all kinds of data for the modules to be calibrated, which can be provided to the user to adjust the parameters to obtain better image quality.
The architecture of CviPQ Tool is shown in Fig. 2.1 , which is mainly divided into PC Calibration Tools, online Tuning Tools, Analysis Tools and Dump Tools.
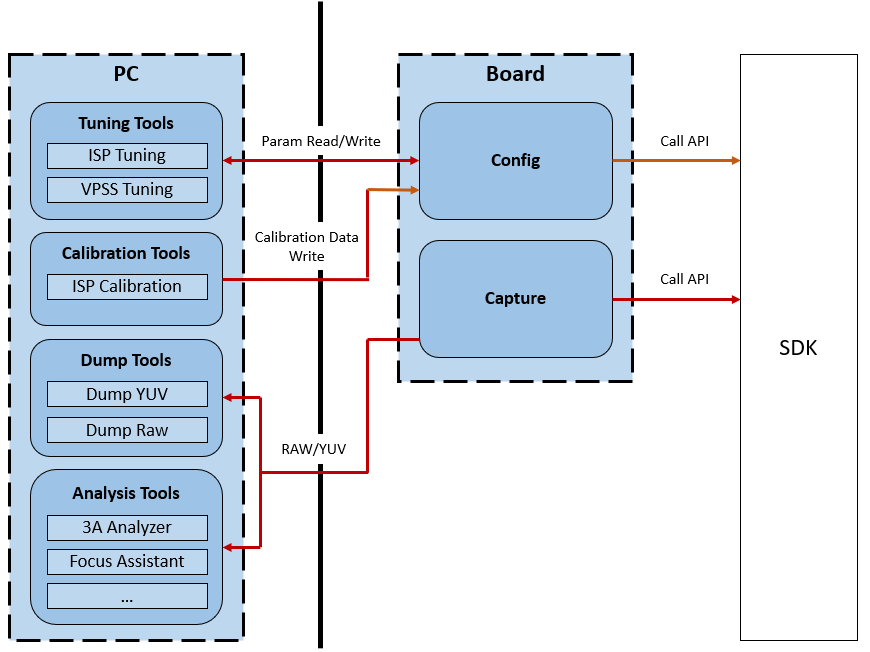
Fig. 2.1 CviPQ Tool Architecture
2.2. Environment Preparation Instructions
2.2.1. Software and Hardware Requirements
Hardware Requirements
Desktop computer or portable computer
Single board hardware (with network port)
Network cable
A resolution of at least 1024 high and 768 wide for the display, respectively
Software Requirements
Install at least Windows 7 64-bit or above
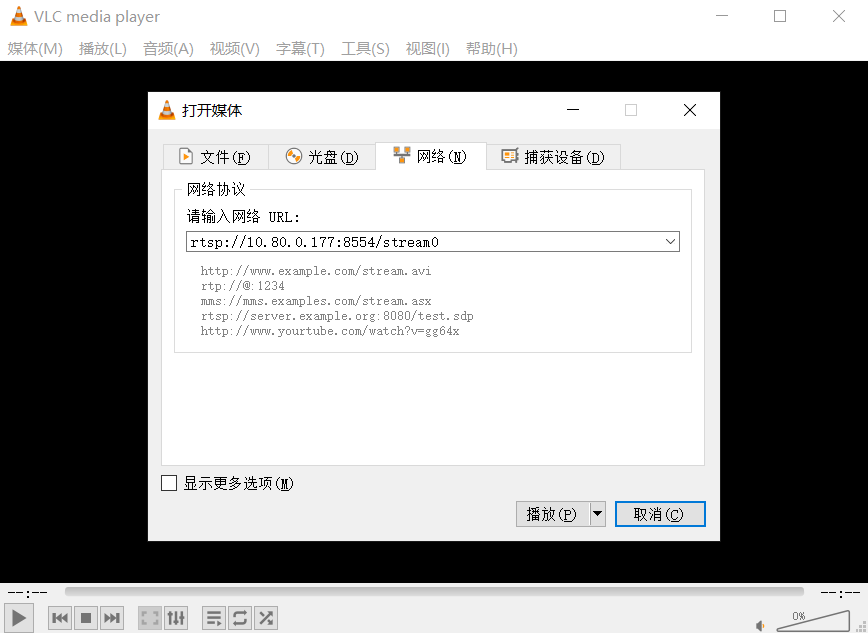
Media player, such as VLC media player
2.2.2. Physical Link Connection
CviPQ Tool is divided into two parts: PC client software and board service software, which interact through network communication.
Physical link connection can use direct connection and local area network connection:
Direct connection:
Connect the two ends of the network cable to the network ports of PC and board respectively.
Local area network:
Connect the network port at the board end to the local port (LAN port) of the router with the network cable.
If the PC uses wireless network, connect the PC to the wireless hotspot of the current router according to the access method of wireless hotspot; if the PC uses wired network, connect the PC network port and the local port (LAN port) of the router with network cable.
2.2.3. EVB Uart Connection Description
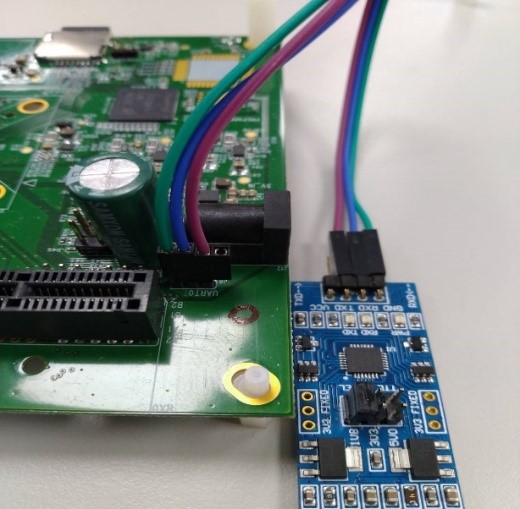
Please refer to the picture below to connect UART with EVB. (take CV183X EVB as an example). For detailed board interface description, please refer to “EVB hardware guide”.
2.2.4. Release Package Description
Copy isp_tool_daemon.tar.gz from the release package to the board side, unzip it to generate the install directory, the directory structure is shown in the following figure.
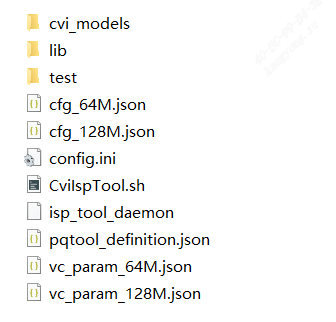
config.ini is the configuration file when running isp_tool_daemon, including configuring the log printing level, setting the default path for PQbin generation, and the path to the sensor type file.
CviIspTool.sh is the script file to quickly start isp_tool_daemon.
2.2.5. Installation and operation of board-side software on Linux systems
Step1. The directory structure of isp_tool_daemon.tar.gz after unpacking is shown in section 2.2.4 .
Step2. Configure board-side IP, ifconfig eth0 xxx.xxx.xxx.xxx
Step3. Enter the unzip and generate the install directory. cd /mnt/sd/install
Step4. Excute the command “./CviISPTool.sh 128M” to start the board program.
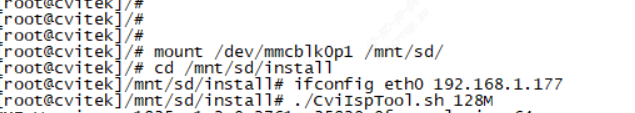
Step5. Connect VLC to display image
Step6. Open CviPQTool on the PC and enter the board IP to connect board

2.3. PC Software Installation
Cvipq tool PC software is a green installation-free software. You only need to decompress the software package to any writable directory. Find CviPQTool.exe in the decompressed directory and double-click to run.
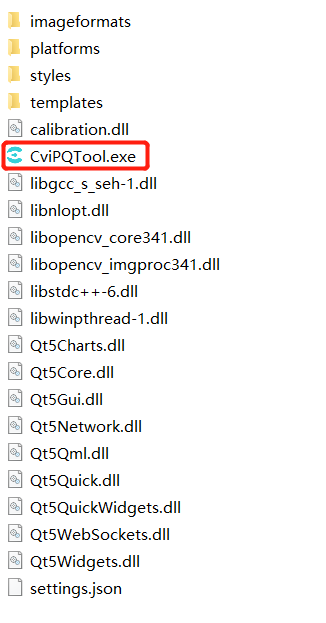
Fig. 2.2 Decompressed directory structure
CviPQTool.exe is the executive program of CviPQ Tool, which can be run by double-click or right-click.
settings.json is the configuration file for CviPQ Tool, where the parameters are saved when the user clicks to remember the settings when connecting to the single board interface
The directory of imageformats/platforms/styles is the library file of plug-ins that CviPQ Tool depends on. Other DLL library files are mainly the runtime libraries of Qt and opencv.
2.4. Quick Start
2.4.1. Interface of Connecting Single Board
Whenever the user is running the CviPQTool.exe, the connection board window will pop up as shown in Fig. 2.3 to allow users to quickly connect the board for image quality tuning.
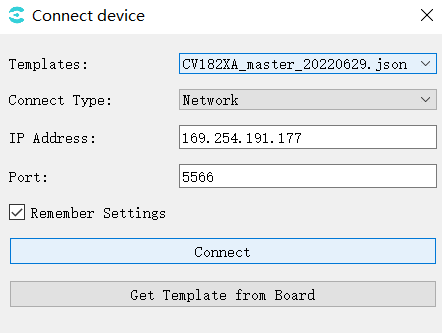
Fig. 2.3 Example of connecting single board interface
Templates: Select tool ui template;
Connect Type: Network connection;
IP Address: Board-side IP address;
Port: Port number;
Remember Settings: Save the current window settings to settings.json and import them automatically the next time you open the tool.
Get Template from Board: Get the ui template from the board ( or manually put the ui json file into the templates directory, restart tool, and then select from the Templates dropdown box)
After setting the options, click the “Connect” button to enter the main interface of the tool. The tool will automatically connect the PC and the board through the network, and will automatically read the parameter values of all debugging items from the board.
Note
When open the tool, the initial default ui template is in Templates, you can click the Get Template from Board button to get the latest matching ui template from the board, then select the json just obtained from the Templates drop-down box, then click the Connect button and wait for the initialized Ui to enter the main interface of the tool.
2.4.2. Tool Main Interface
The main interface of the tool is shown in Figure 2-4.
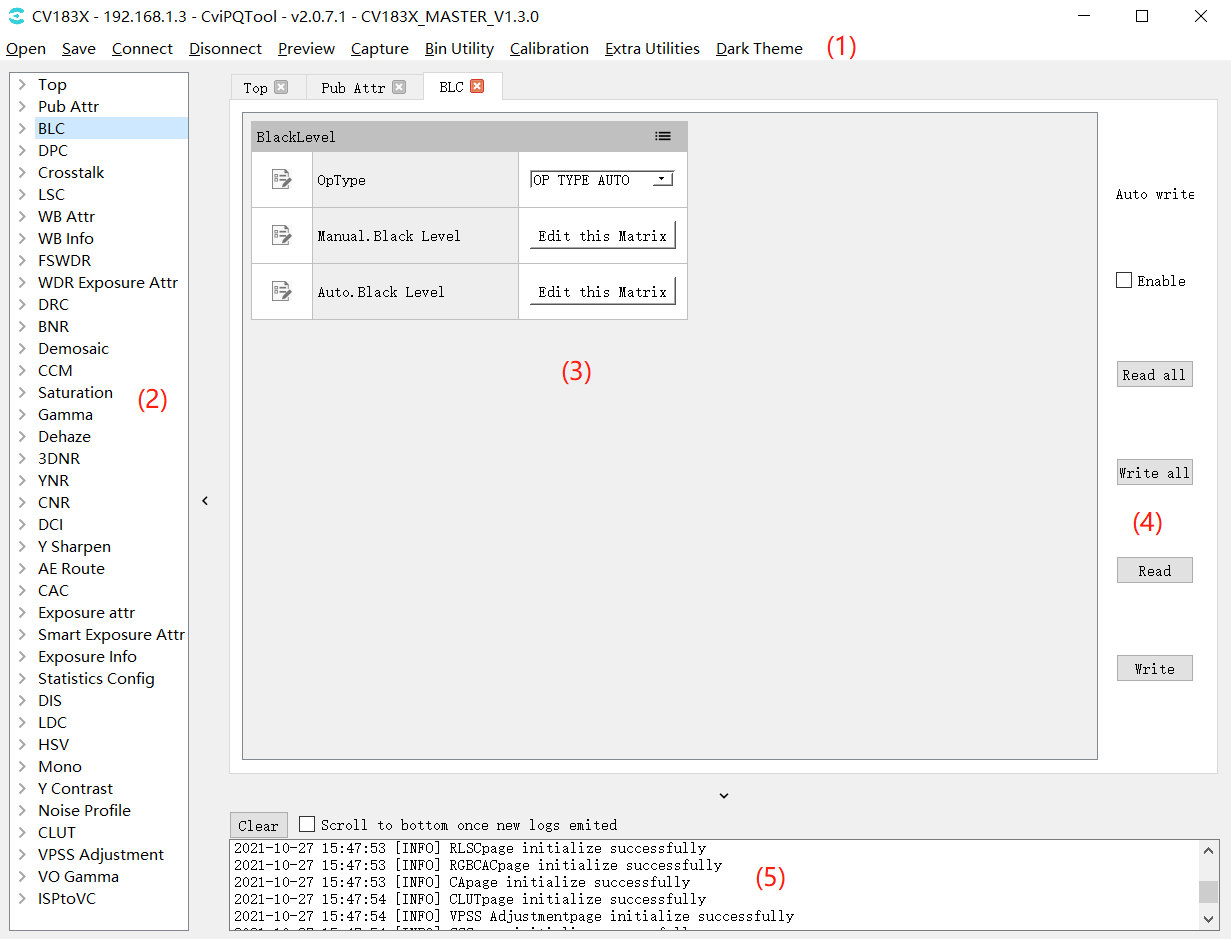
Fig. 2.4 Tool Main Interface
The main interface of CviPQ Tool can be divided into the following areas:
(1). Toolbar: provides some common shortcut options
(2). Tuning panel: displays the tunable items of all modules
(3). Tuning area: this area will display the tuning page corresponding to the module selected in the tuning panel
(4). Read / Write: automatically read/write and read/write all pages or current page data can be chose here.
(5). Prompt Bar: display communication log
2.4.3. Common Operations
2.4.3.1. Save Tuning Data Files
When clicking the “Save” button in the toolbar, a dialog box for selecting a path will pop up. When the user selects a storage path, the tool will save the parameters of the current debug panel table in the format of *.json, storing the parameters and the structure of the debug table.
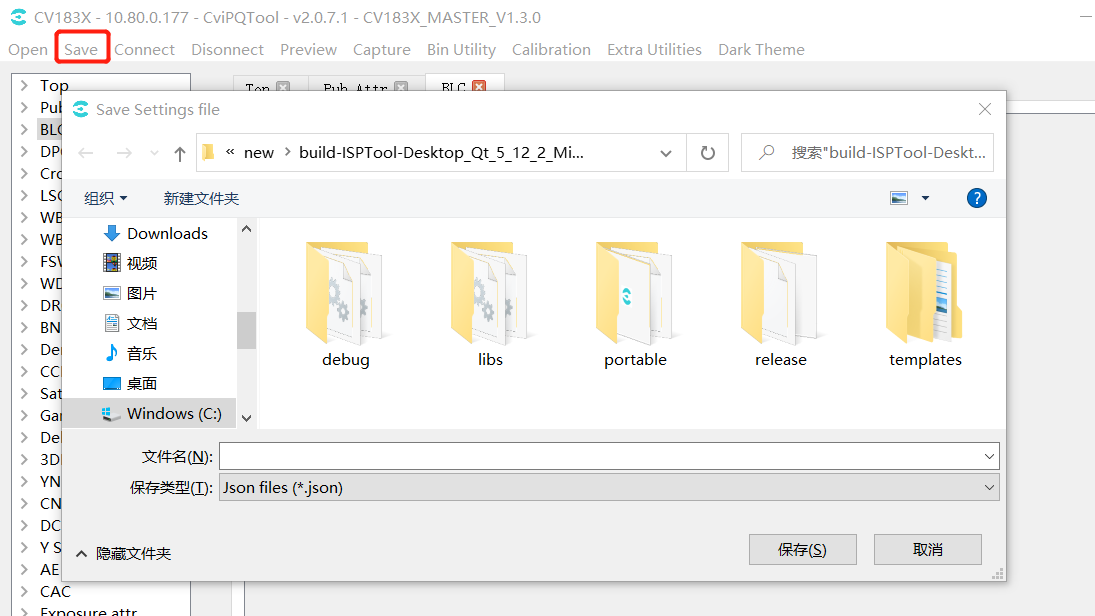
Fig. 2.5 Example of interface for storing tuning data files
2.4.3.2. Open Tuning Data File
When clicking the “Open” button in the toolbar, a dialog box will pop up for the user to select the data file to be opened. When the data file is opened, the tool will load the relevant parameters in the file and display them in the tool tuning panel.
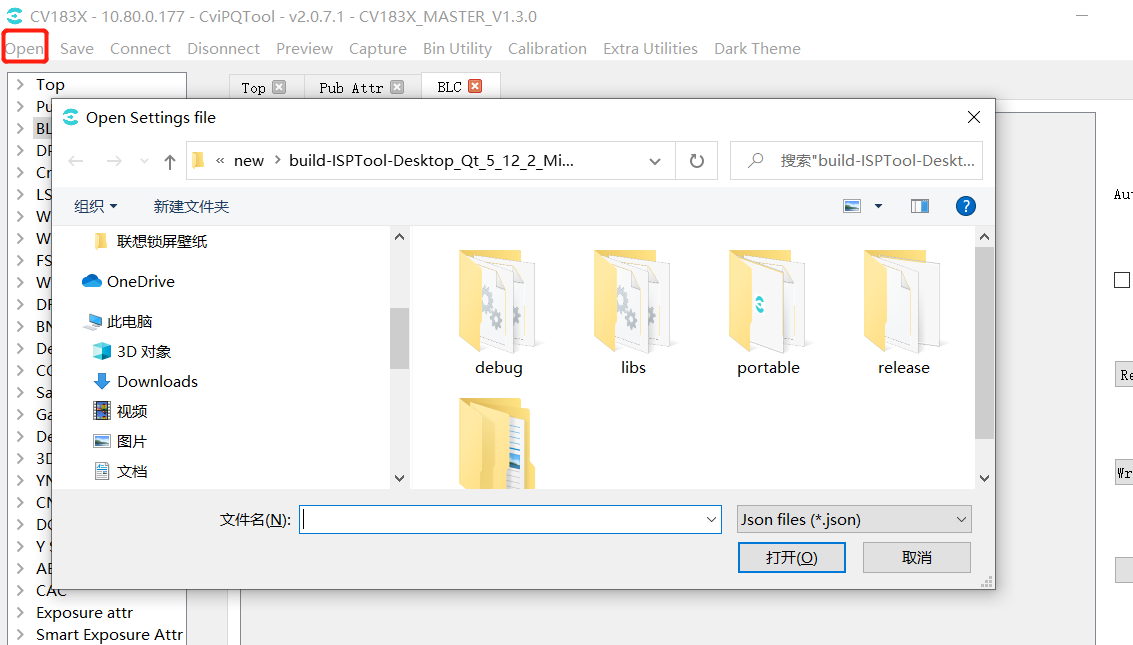
Fig. 2.6 Example of Opening Tuning Data File Interface
2.4.3.3. Connect the Single Board
Click the “Connect” button in the toolbar, and the connect board window will pop up, as shown in Fig. 2.7 . The user can enter the IP address of the board in the “IP address” field and the port number in the “Port” field, and then click “Connect” to connect the tool to the single board.
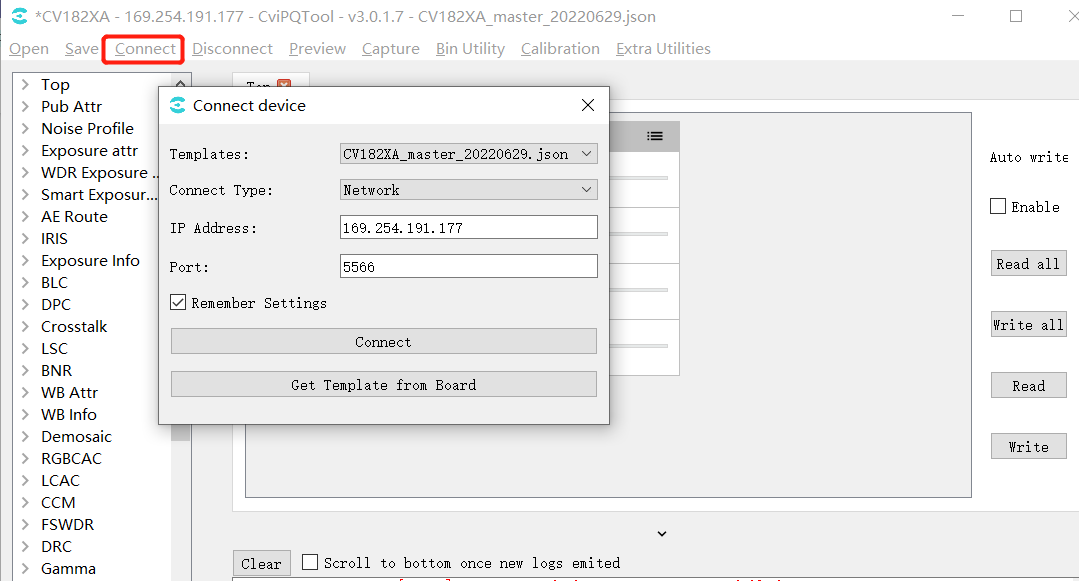
Fig. 2.7 Connect Window
2.4.3.4. Disconnect from the Single Board
When the tool is connected to a single board, click on the “Disconnect” button in the toolbar to disconnect the tool from the single board
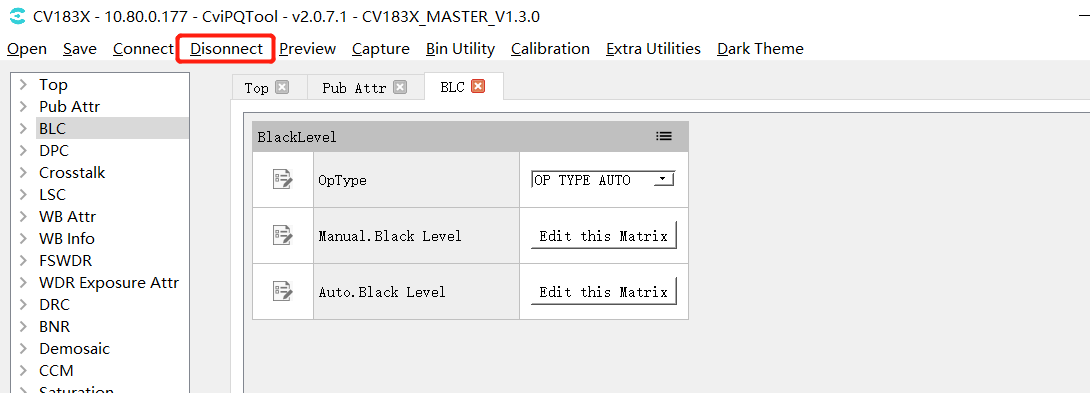
Fig. 2.8 Disconnect button
2.4.3.5. Image Preview
Click the “Preview” button on the toolbar, the Preview window will pop up, click the “Get Single Image” button, the image will be captured and displayed. (The tool is connected to the single board, and the single board is connected to the VLC or the display to show the image normally)
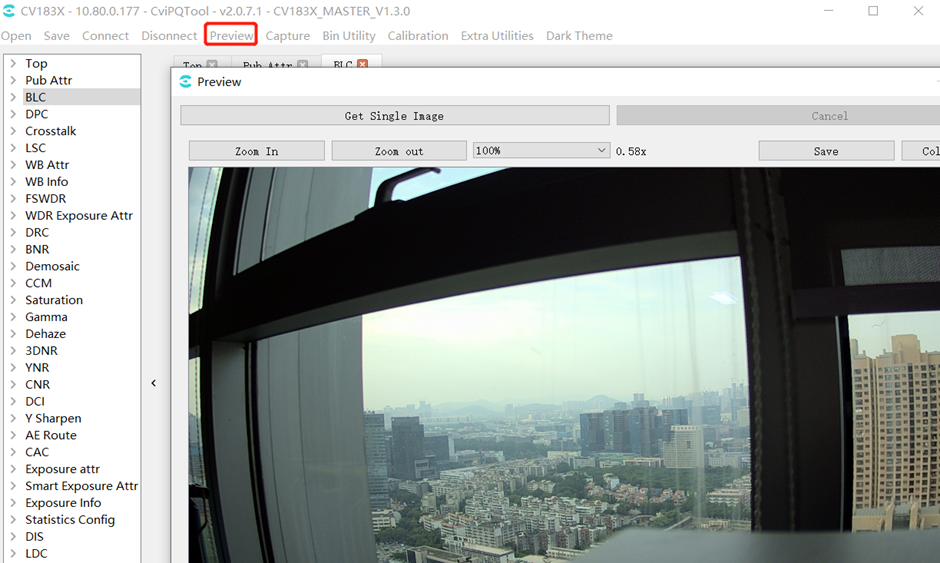
Fig. 2.9 Image preview window
2.4.3.6. Capture Tool
Click “Capture” button on the toolbar and the Capture Tool window will pop up as shown in the figure, see section 3.4.1 for details.
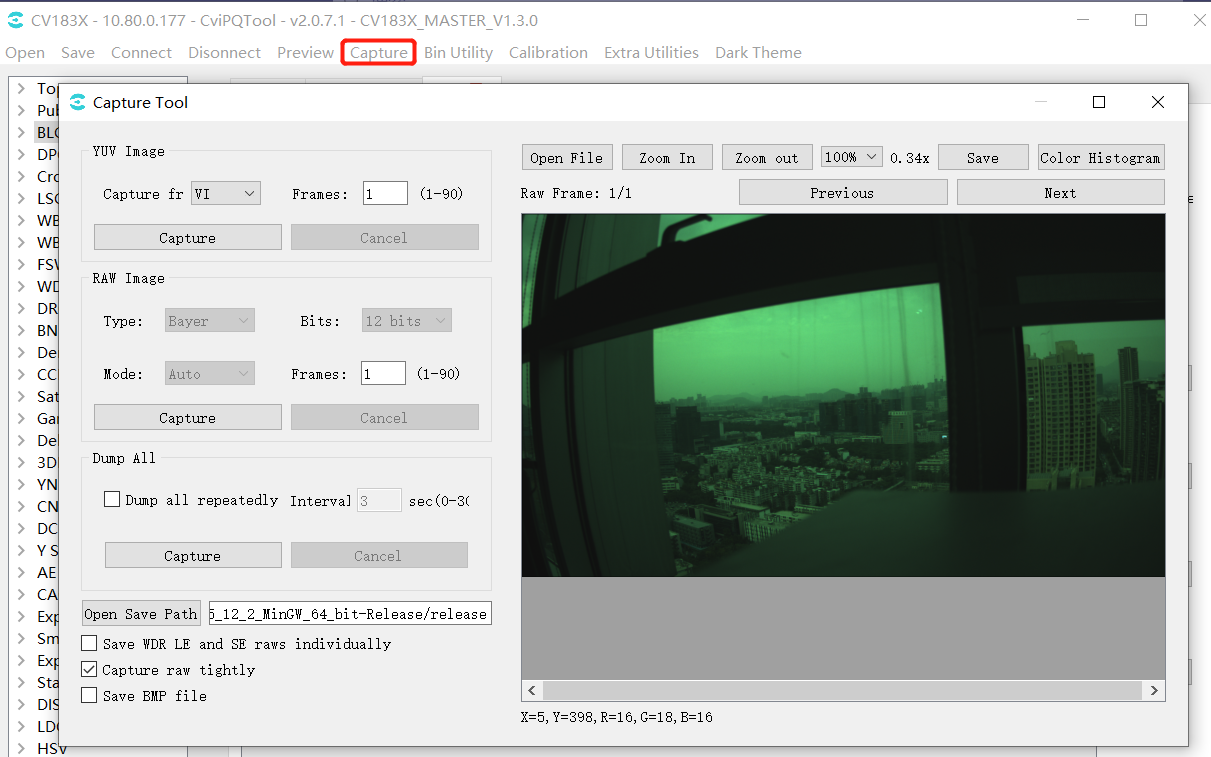
Fig. 2.10 Capture tool window
2.4.3.7. Bin Import and Export
Click ” Bin Utility Tool ” button on the toolbar and the Bin Utility Tool window will pop up as shown in the figure
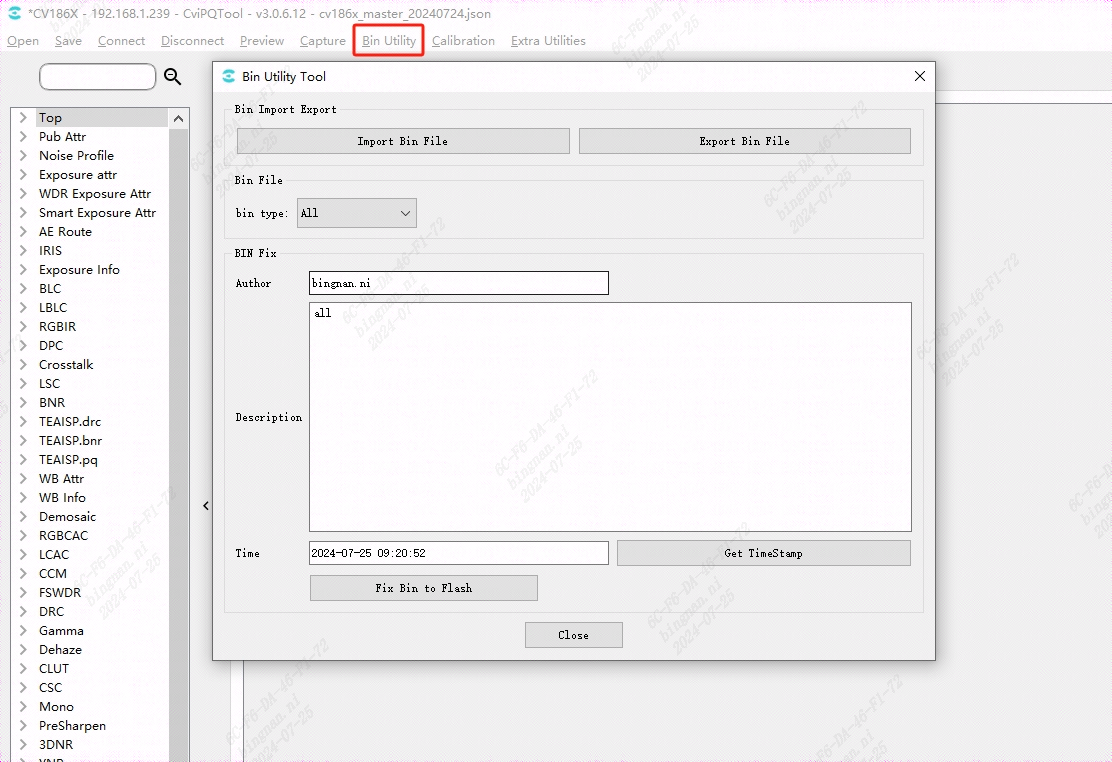
Fig. 2.11 Import and Export
Export Bin File: exporting board-side parameters to the pc and save them as bin files.
Import Bin File: import pc-side bin files to the board side.
Fix Bin To Flash: generate bin files on the board side.
Author,Description,Time are file description information, which will be printed on the serial port when the bin is loaded by running on the board side.
2.4.3.8. Calibration Tool
Click ” Calibration ” button on the toolbar and the Calibration Tool window will pop up as shown in the figure, see section 3.2 for details.
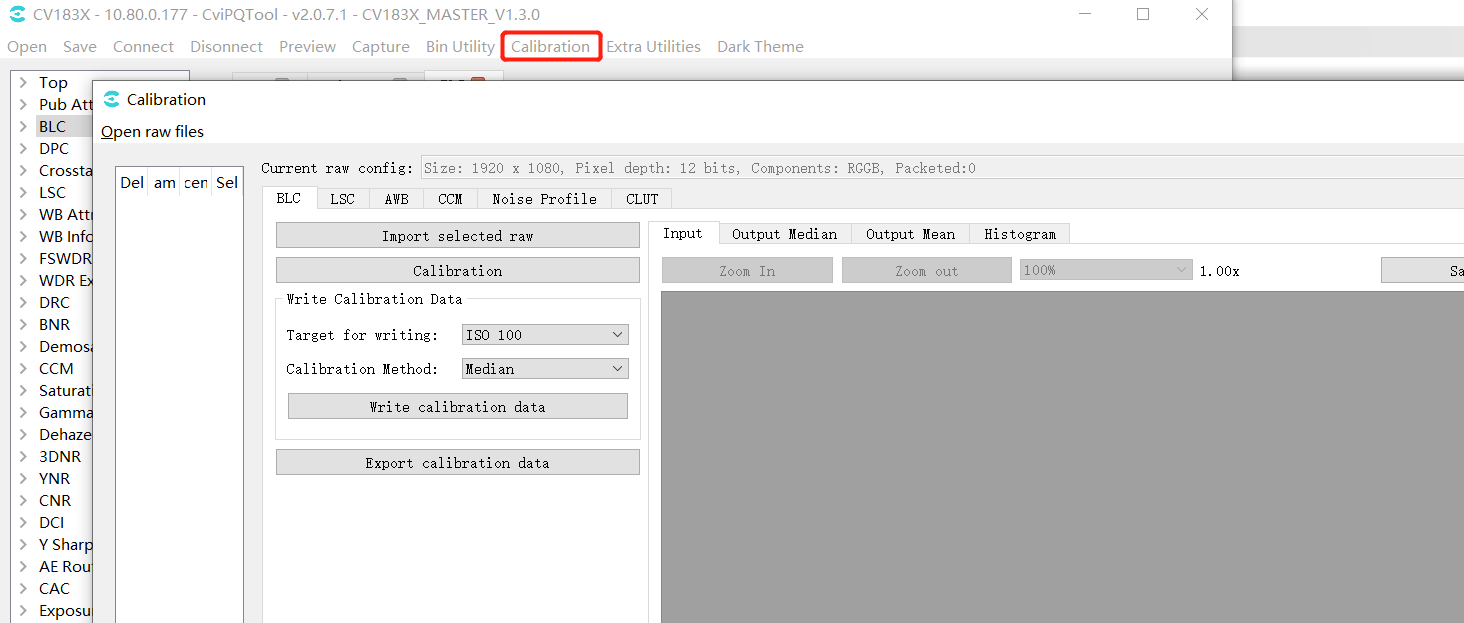
Fig. 2.12 Calibration tool window
2.4.3.9. Auxiliary Tools
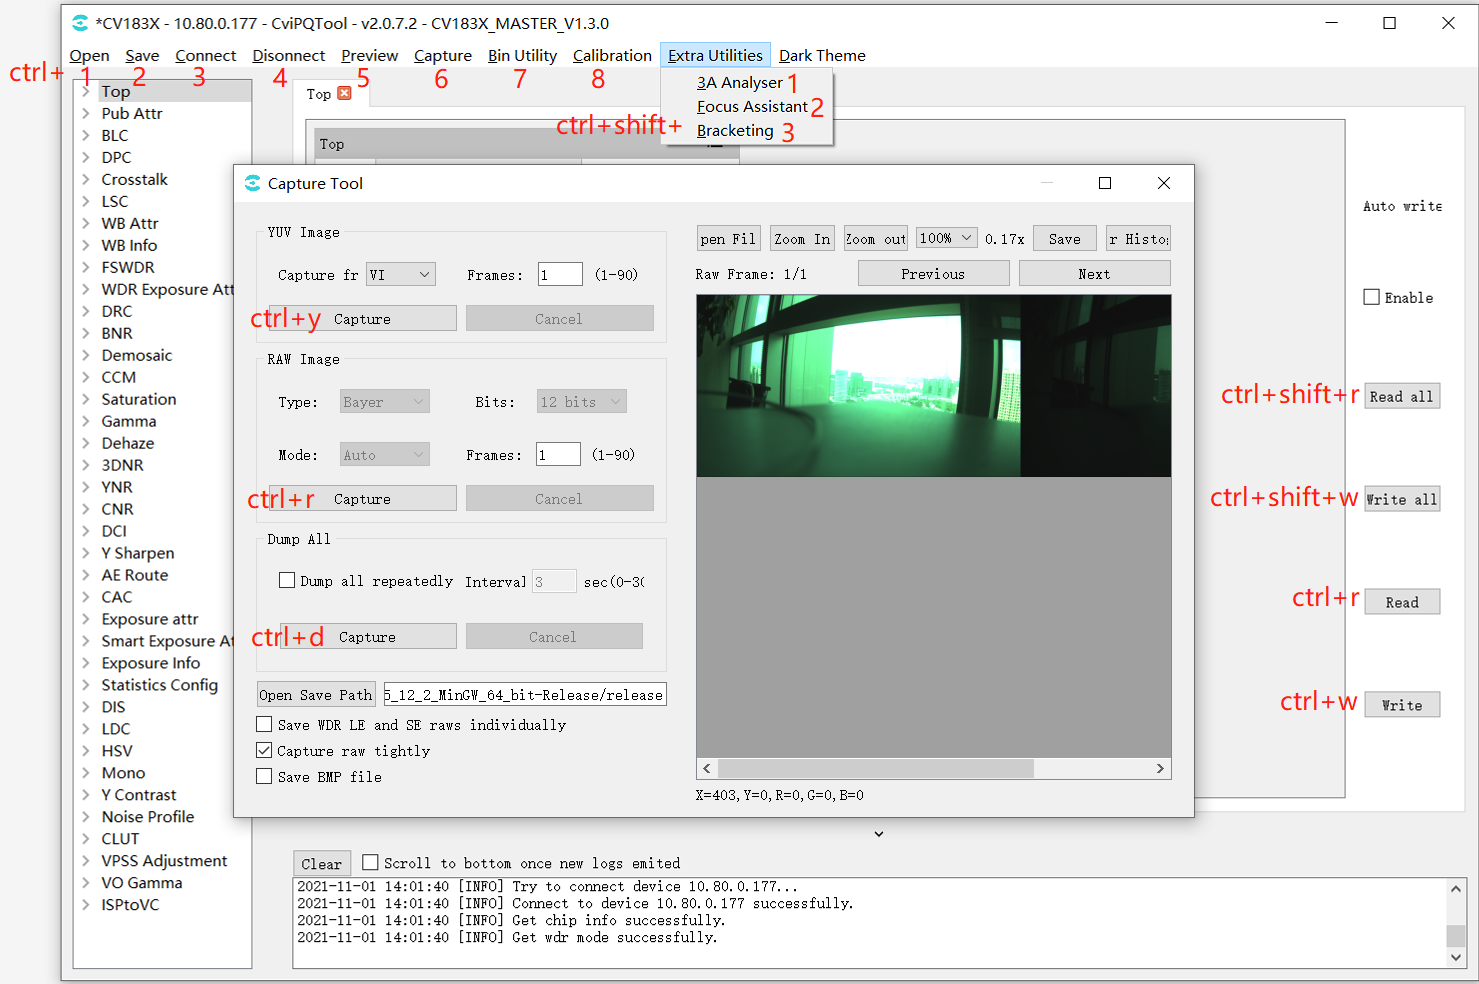
Click the toolbar “Extra Utilities” button to bring up the drop-down options for 3A Analyser, Focus Assistant, Bracketing, Continuous Raw and DRC Tone Viewer tools, see section 3.4 for details.
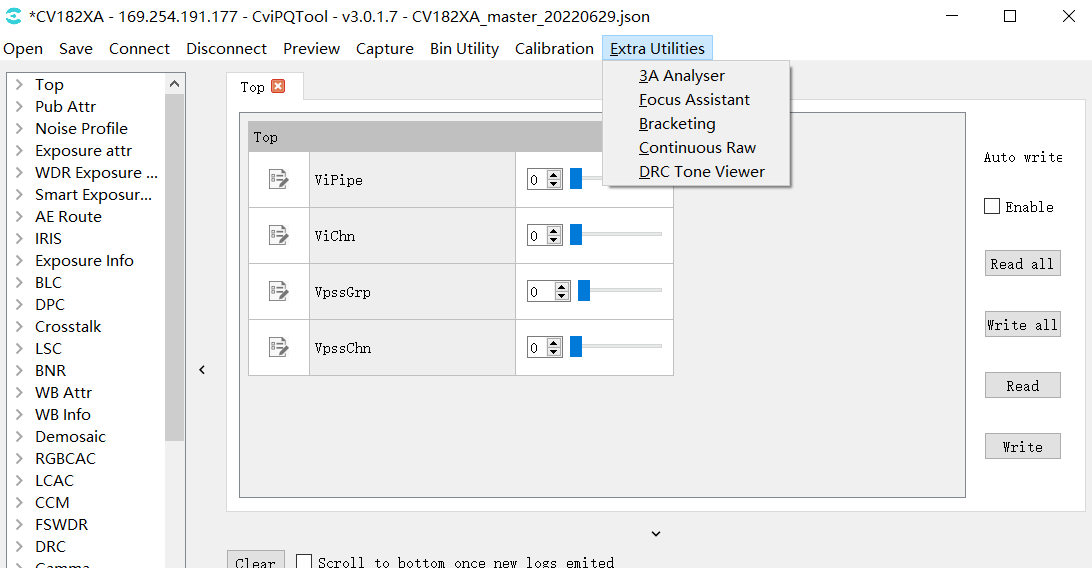
Fig. 2.13 Auxiliary tools window
2.4.3.10. Shortcuts
The shortcuts are shown below.