15. 附录06:TDB调试工具使用指南
本章节主要介绍TDB(Tensor Debugger)工具的使用方法,TDB提供了一个和gdb、pdb界面类似的调试窗口,可用于调试 BModel 运行流程,具有添加断点、单步执行、查看内存数据、数据比对、等功能。
此工具目前支持 BM1684、BM1684X、BM1688。
15.1. 准备工作
环境配置
首先需要参考 开发环境配置章节 完成环境配置,进入TPU-MLIR的Docker容器,并在其中安装tpu_mlir。
若已完成环境配置可忽略此步骤。
生成bmodel
在使用TDB之前需要先通过TPU-MLIR生成bmodel文件,可参考 编译ONNX模型章节 中的命令从模型生成bmodel文件。
需要使用以下2个命令:
# 将ONNX模型转换为top_mlir
$ model_transform
# 将top_mlir转换为bmodel
$ model_deploy
其中,model_deploy 命令需要添加 --debug 和 --compare_all 参数,用于保存 tpu_output.npz 文件并保留中间数据。
生成 bmodel 时,会自动产生带有 compilation.bmodel 和 final.mlir 文件的目录,此目录称为 Context 目录。
15.2. 启动TDB
$ tdb [-h]
      [--inputs [INPUTS]]
      [--ref_data [REF_DATA ...]]
      [--plugins [PLUGINS]]
      [--ddr_size [DDR_SIZE]] [-v]
      [context_dir]
tdb 命令的主要参数说明如下:
参数名 |
必选? |
说明 |
|---|---|---|
context_dir |
是 |
bmodel文件所在目录,默认为当前目录 |
-h, –help |
否 |
显示帮助信息 |
–inputs |
否 |
指定bmodel文件的输入数据 |
–ref_data |
否 |
指定bmodel文件的参考数据 |
–plugins |
否 |
添加额外的插件 |
–ddr_size |
否 |
指定cmodel的ddr_size |
-v, –verbose |
否 |
使用进度条 |
启动TDB示例:
$ tdb
# 等效于
$ tdb ./
15.3. TDB命令汇总
在进入TDB后,按下两次 tab 可以获取命令提示。显示效果如下:
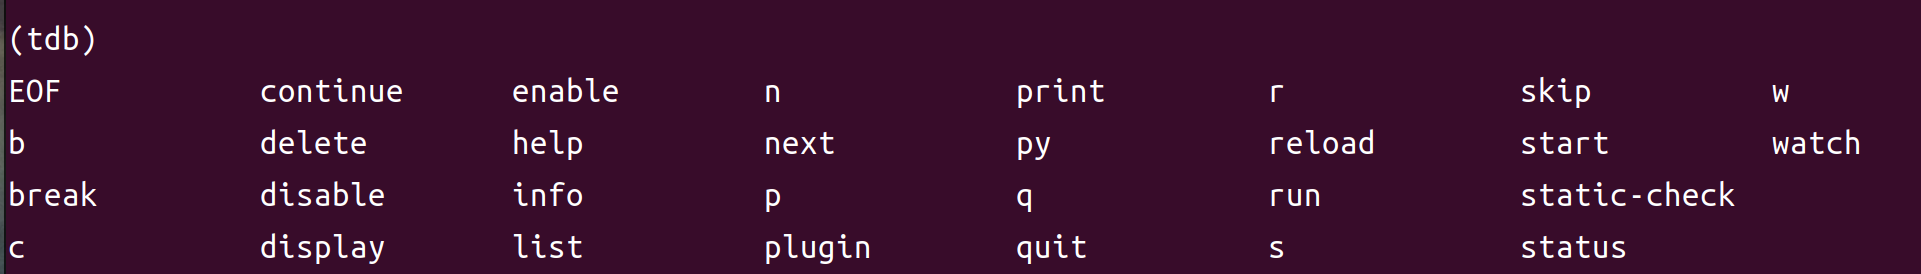
进入TDB后,可使用的命令如下:
命令 |
说明 |
|---|---|
s/start |
加载 bmodel 并进行初始化 |
r/run |
从头执行到结束,run 指令包含初始化功能 |
b/break |
在 final.mlir 中添加断点 |
delete |
删除断点 |
n/next |
执行下一条指令,可以使用 n [num] 执行多条指令 |
c/continue |
继续执行指令,直至断点或运行结束 |
info |
打印断点信息或不同格式的指令 |
p/print |
打印当前指令或指令对应的数据 |
w/watch |
监视当前或上一条原子指令的某个输入/输出,当其所在地址的数据变化时返回提示 |
q/quit |
退出TDB |
py [py_cmd] |
在TDB中执行 python 命令,集成了 pdb 的代码补全功能 |
其中,num 为数字;py_cmd 为python命令。
15.4. TDB使用流程
# 在context目录启动TDB
$ cd path/to/context_dir
$ tdb
# 初始化
$ s
# 逐条执行
$ n
# 添加断点
$ b
# 继续运行
$ c
# 继续调试
$ info/p/w
# 退出
$ q
15.5. TDB功能说明
15.5.1. next功能
# 使用next单步执行
(tdb) n
# 使用next执行多条指令
(tdb) n [num]
# 使用next执行3条指令
(tdb) n 3
n 命令后显示的指令为下一条未执行指令。
15.5.2. breakpoint功能
breakpoint功能包含查看断点、添加/删除断点、开启/关闭断点功能。使用方法如下:
命令 |
说明 |
示例 |
|---|---|---|
info b/break |
查看断点信息 |
info b; info break |
b/break |
添加断点 |
b 1 |
enable |
开启断点 |
enable 1; enable 1,2 |
disable |
关闭断点 |
disable 1; disable 1,2 |
delete |
删除断点 |
delete 1 |
目前支持的断点类型如下:
value-id
bmodel 对应的 final.mlir 中的 Operation 前缀,例如:
%140 = "tpu.Load"(%6) {do_bcast = false …
其中, %140 和 %6 即为 value-id ,添加此类型断点示例如下:
(tdb) b %140
(tdb) b %6
op-name
final.mlir 中的 Operation 的名称,上述例子中, tpu.Load 即为 Op 名称,添加此类型断点示例如下:
(tdb) b tpu.Load
cmd-id
解析出的 asm 的 cmd-id,上述例子中,D1 和 B0 即为 cmd-id,添加此类型断点示例如下:
(tdb) b D2
(tdb) b B4
15.5.3. info功能
info功能可以打印断点信息或不同格式的指令,使用方法如下:
info b
查看断点信息。
(tdb) info b
index     type enable     text hit
    1  dialect      y tpu.load   0
    2     addr      y       R0   3
    3   cmd-id      y       D1   0
    4 value-id      y       %7   0
info asm
查看当前的 asm 指令。
(tdb) info asm
%R0, %B15 = "arith.add"(%R13, %C1.0, %D3) {round_mode = 0} : (memref<1x32x54x160xf32, strides: [8640, 8640, 160, 1]>, f32, none) -> (memref<1x32x54x160xf32, strides: [8640, 8640, 160, 1]>, none)
info mlir
查看当前指令对应在 final.mlir 中的 Operation 。
(tdb) info mlir
%137 = "tpu.Active"(%134) {ginfo = #tpu.lg<out_addr = 212992, out_size = 35456, buffer_addr = 0, buffer_size = 71040, eu_align = true, n_idx = [0], n_slice = [1], c_idx = [0], c_slice = [32], d_idx = [0], d_slice = [1], h_idx = [0, 53, 107, 161, 215, 267], h_slice = [54, 55, 55, 55, 53, 53], w_idx = [0, 159], w_slice = [160, 161], id = 6, stage = 1, group_type = 0>, mode = #tpu<active_mode SILU>} : (tensor<1x32x320x320xf32>) -> tensor<1x32x320x320xf32> loc(#loc19)
info reg
查看当前指令解析后各字段的值。
(tdb) info reg
{'cmd_short': 1, 'cmd_id': 15, 'cmd_id_dep': 3, 'tsk_typ': 3, 'tsk_eu_typ': 2, 'opd0_const': 0, 'opd1_const': 1, 'opd2_const': 0, 'tsk_opd_num': 2, 'cmd_id_en': 1, 'pwr_step': 0, 'intr_en': 0, 'res0_prec': 2, 'opd0_prec': 2, 'opd1_prec': 2, 'opd2_prec': 0, 'opd0_sign': 1, 'opd1_sign': 1, 'res0_str': 0, 'opd0_str': 0, 'opd1_str': 0, 'opd2_n_str': 0, 'rsvd0': 0, 'res0_n': 1, 'res0_c': 32, 'res0_h': 54, 'res0_w': 160, 'res0_addr': 0, 'opd0_addr': 212992, 'opd1_addr': 1065353216, 'opd2_addr': 0, 'res0_n_str': 0, 'res0_c_str': 0, 'opd0_n_str': 0, 'opd0_c_str': 0, 'opd1_n_str': 0, 'opd1_c_str': 0, 'res0_h_str': 0, 'res0_w_str': 0, 'opd0_h_str': 0, 'opd2_sign': 0, 'rsvd1': 0, 'opd0_w_str': 0, 'opd1_h_str': 0, 'opd1_w_str': 0, 'rsvd2': 0}
info loc
查看 Context 目录中,tensor_location.json 中对应的 Operation 信息。
(tdb) info loc
{'core_id': 0,
'file_line': 27,
'loc_index': 4,
'opcode': 'tpu.Active',
'operands': [@163840({name=122_Conv, layout=eu_align, slice=[0:1, 0:32, 0:1, 0:54, 0:160], mlir_type=tensor<1x32x320x320xf32>, memory_type=<1x32x54x160xf32>})],
'results': [@212992({name=124_Mul, layout=eu_align, slice=[0:1, 0:32, 0:1, 0:54, 0:160], mlir_type=tensor<1x32x320x320xf32>, memory_type=<1x32x54x160xf32>})],
'slice_all': False,
'subnet_id': 0,
'tiu_dma_id_after': [17, 3],
'tiu_dma_id_before': [1, 3]}
15.5.4. print功能
print功能不仅可以打印当前的asm指令,还可以打印指令的输入和输出数据,使用方法如下:
命令 |
说明 |
示例 |
|---|---|---|
p op |
查看即将执行的指令 |
p op |
p pre/next |
查看上一条或下一条指令 |
p pre; p next |
p in |
查看下一条未执行指令的输入数据 |
p in; p in 0 |
p out |
查看上一条已执行指令的输出数据 |
p out; p out 0 |
15.5.5. watchpoint功能
watchpoint功能可以监视指令的输入/输出数据,当某个监视变量的数据发生变化时会返回提示,使用方法如下:
w
查看当前已添加的 watchpoint,示例如下:
(tdb) w
index    cmd_type cmd_id core_id enabled                                                   value
    1 CMDType.dma      2       0       y %G0: memref<1x32x3x36xf32, strides: [3456, 108, 36, 1]>
w in
将下一条待执行指令的某个输入添加为 watchpoint,示例如下:
(tdb) n
%R15.2688, %D2 = "dma.tensor"(%G0, %B0) {decompress = False} : (memref<1x32x3x36xf32, strides: [3456, 108, 36, 1]>, none) -> (memref<1x32x3x36xf32, strides: [108, 108, 36, 1]>, none)
(tdb) w in 0
(tdb) w
index    cmd_type cmd_id core_id enabled                                                   value
    1 CMDType.dma      2       0       y %G0: memref<1x32x3x36xf32, strides: [3456, 108, 36, 1]>
可以看到,w in 0 将下一条待执行指令的第一个输入 %G0 添加为 watchpoint 。
w out
将上一条已执行指令的某个输出添加为 watchpoint,示例如下:
(tdb) w out 0
(tdb) w
index    cmd_type cmd_id core_id enabled                                                         value
    1 CMDType.dma      2       0       y       %G0: memref<1x32x3x36xf32, strides: [3456, 108, 36, 1]>
    2 CMDType.dma      1       0       y %R0: memref<1x3x110x322xf32, strides: [35424, 35424, 322, 1]>
p w idx old/now
打印已添加 watchpoint 的值,示例如下:
其中 idx 是使用 w 命令返回的 watchpoint 的 index ,old 表示查看该 watchpoint 最初被添加时的数据,now 表示查看 watchpoint 当前数据。
old/now 可省略,默认为 now,即查看 watchpoint 当前数据。
(tdb) w
index    cmd_type cmd_id core_id enabled                                                         value
    1 CMDType.dma      2       0       y       %G0: memref<1x32x3x36xf32, strides: [3456, 108, 36, 1]>
    2 CMDType.dma      1       0       y %R0: memref<1x3x110x322xf32, strides: [35424, 35424, 322, 1]>
(tdb) p w 1
(tdb) p w 1 old
w delete [idx]
删除已添加的 watchpoint,示例如下:
当输入 idx 时表示删除对应的 watchpoint,不输入 idx 时表示删除全部的 watchpoint。
(tdb) w
index    cmd_type cmd_id core_id enabled                                                         value
    1 CMDType.dma      2       0       y       %G0: memref<1x32x3x36xf32, strides: [3456, 108, 36, 1]>
    2 CMDType.dma      1       0       y %R0: memref<1x3x110x322xf32, strides: [35424, 35424, 322, 1]>
    3 CMDType.tiu     11       0       y %R13: memref<1x32x54x160xsi16, strides: [8640, 8640, 160, 1]>
(tdb) w delete 1
(tdb) w
index    cmd_type cmd_id core_id enabled                                                         value
    2 CMDType.dma      1       0       y %R0: memref<1x3x110x322xf32, strides: [35424, 35424, 322, 1]>
    3 CMDType.tiu     11       0       y %R13: memref<1x32x54x160xsi16, strides: [8640, 8640, 160, 1]>
(tdb) w delete
(tdb) w
index cmd_type cmd_id core_id enabled value
15.5.6. py功能
py功能可以在TDB环境下直接执行python命令,使用方法如下:
(tdb) py a = 2
(tdb) py b = a + 2
(tdb) py print(b)
4
15.6. BModel Disassembler
BModel Disassembler 可以对 bmodel 文件进行反汇编得到 MLIR 格式的 atomic 指令的汇编代码,即 asm 指令,用于分析模型的最终运行命令。
使用时首先需要进入 Context 目录,使用方法如下:
$ bmodel_dis [-h] [--format {mlir,reg,bits,bin,reg-set}] bmodels [bmodels ...]
其中, --format 可以指定输出格式,默认使用mlir格式,bmodels 表示要解析的bmodel文件。使用示例如下:
$ bmodel_dis compilation.bmodel
$ bmodel_dis --format reg compilation.bmodel
可将输出结果保存至文件,方法如下:
$ bmodel_dis compilation.bmodel > dis_bmodel.mlir
$ bmodel_dis --format reg compilation.bmodel > dis_reg.json
15.7. BModel Checker
BModel Checker 用于查找 bmodel 中的错误(codegen错误),如果在 model_deploy 时发现生成的 bmodel 无法与 tpu 的参考数据对齐,则可以使用该工具来定位错误。目前支持 BM1684、BM1684X、BM1688 处理器的 BModel。
在生成 bmodel 文件时,model_deploy 命令需要添加 --debug 和 --compare_all 参数,用于保存 tpu_output.npz 文件并保留中间数据。
使用方法如下:
$ bmodel_checker [-h]
                 [--tolerance TOLERANCE]
                 [--report REPORT] [--fail_fast]
                 [--quiet] [--no_interactive]
                 [--dump_mode {failed,all,never}]
                 context_dir reference_data
bmodel_checker 的主要参数说明如下:
参数名 |
必选? |
说明 |
|---|---|---|
context_dir |
是 |
bmodel文件所在目录 |
reference_data |
是 |
tpu_output.npz文件位置 |
quiet |
否 |
不显示执行进度条 |
fail_fast |
否 |
在发现第一个错误的时候就停下来 |
dump_mode |
否 |
指定dump命令下载的数据,默认为failed,还可以是all或never |
tolerance |
否 |
指定比较容差,默认为 “0.99,0.90” |
report |
否 |
将错误结果输出成文件,默认为 failed_bmodel_outputs.npz |
no_interactive |
否 |
运行完 bmodel_checker 会直接退出 TDB 模式 |
使用 bmodel_checker 需要进入 Context 目录,使用示例如下:
$ bmodel_checker ./ ../yolov5s_bm1684x_f32_tpu_outputs.npz
$ bmodel_checker ./ ../yolov5s_bm1684x_f32_tpu_outputs.npz --fail_fast
$ bmodel_checker ./ ../yolov5s_bm1684x_f32_tpu_outputs.npz --tolerance 0.99,0.90
执行 bmodel_checker 命令后,会输出检查报告,并将错误的输出结果保存到 failed_bmodel_outputs.npz 文件中,下面对检查报告进行说明:

其中,“对勾”表示通过,即该数据被检查,且其相似度符合 cos>0.99, eul>0.9 (默认阈值,可通过 tolerance 参数修改);“叉号”表示错误,即该数据没有达到要求的相似度;“问号”表示未知,即没有找到对应的参考数据,无法确定此数据的正确性。一个 yolov5s 模型的完整检查报告如下图所示:

输出检查报告后会自动进入交互模式。交互模式可提供对错误的详细浏览,而且还可以快速在不同行之间跳转,下面以一个 cswin_tiny 模型为例展示其使用方法。
check summary
使用 check summary 命令可以重新打印检查报告,使用示例如下:

值得一提的是,使用 check summary reduce 命令可以聚合相同行号的输入和输出。
check data
(tdb) check data [file-line]
其中, file-line 为检查报告中的行号,对应 final.mlir 的行号。此命令可以给出 file-line 对应指令的所有输入输出数据的描述信息,使用示例如下:

(tdb) check data [file-line] [index]
其中, index 为 check data [file-line] 命令输出数据的 index。此命令可以给出对应 index 数据的详细信息,对比正确的数据示例如下:

对比错误的数据示例如下:
